Indiana Lake Levels and River Flows
Corps reservoir pools, Ohio River dams, USGS live flow and Lake Michigan level.
 Angler pickPiscifun Viper X spinning reel50% OFFSale $39.99
Photo of Cataract Falls at Cagles Mill Lake: Hildegarde Anderson, CC BY-SA 2.0
Indiana lake, river and Lake Michigan levels in one place
Three feeds cover Indiana. USGS stream and lake gauges print live through the site; the eight Corps of Engineers flood-control reservoirs of the Louisville District are shown as one dated pool reading each, taken from the NOAA National Water Prediction Service; and the NOAA river gauges, including the Ohio River pools and tailwaters, print as dated readings too.
Lake Michigan has no active NOAA water-level station on the Indiana shore, so the nearest one, Calumet Harbor on the Illinois side, is used.
Indiana Corps lakes, last pool reading
| Reservoir | Pool | Reading time | NWS gauge |
|---|---|---|---|
| Cagles Mill Lake | 637.53 ft | 2026-11-05 19:15:00 UTC | CAGI3 |
| Cecil M. Harden Lake | 652.56 ft | 2026-11-05 19:15:00 UTC | CHLI3 |
| J. Edward Roush Lake | 745.87 ft | 2026-11-05 19:45:00 UTC | HUNI3 |
| Monroe Lake | 537.58 ft | 2026-11-05 19:25:00 UTC | MONI3 |
| Mississinewa Lake | 730.76 ft | 2026-11-05 19:45:00 UTC | MSSI3 |
| Patoka Lake | 537.45 ft | 2026-11-05 19:15:00 UTC | PRLI3 |
| Salamonie Lake | 748.19 ft | 2026-11-05 14:45:00 UTC | SLAI3 |
| Brookville Lake | 744.42 ft |
USACE Louisville District pool as reported through the NOAA National Water Prediction Service gauge page, read November 5, 2026 (one dated reading, not live; feet as published, datum not printed).
Live flow on Indiana's biggest rivers
| USGS gauge | Latest reading | Time (ET) |
|---|---|---|
| Ohio River At Cannelton Dam At Cannelton, In | 31,000 cfs, 11.40 ft gage height | Nov 6 9:00 pm |
| Ohio River At Newburgh Lock And Dam, In | 14.49 ft gage height | Nov 6 10:00 pm |
| Wabash River At Logansport, In | 2,360 cfs, 4.29 ft gage height | Nov 6 10:15 pm |
| Wabash River At Delphi, In | 4.04 ft gage height | Nov 6 10:15 pm |
US Geological Survey provisional data, retrieved Nov 6, 2026 10:33 pm ET. Provisional readings can be revised.
| USGS gauge | Latest reading | Time (ET) |
|---|---|---|
| Brookville Lake At Brookville, In | 744.19 ft lake elevation | Nov 6 9:45 pm |
| J. Edward Roush Lake Near Huntington, In | 745.85 ft lake elevation | Nov 6 9:45 pm |
US Geological Survey provisional data, retrieved Nov 6, 2026 10:33 pm ET. Provisional readings can be revised.
USGS Water Services instantaneous values through the site plugin, live.
Ohio River pool and tailwater gauges along Indiana
| Gauge | Stage | Flow | Flood category | Reading (UTC) |
|---|---|---|---|---|
| White River (IN) below Broad Ripple Dam | 1.31 ft | – | no flooding | 2026-11-05 19:15:00 UTC |
| East Fork Whitewater River below Brookville Lake | 4.35 ft | 0.703 kcfs | not defined | 2026-11-05 19:45:00 UTC |
| Mill Creek (IN) at Cagles Mill Lake | 637.53 ft | – | no flooding | 2026-11-05 19:15:00 UTC |
| Big Raccoon Creek at Cecil M. Harden Lake | 652.56 ft | – | no flooding | 2026-11-05 19:15:00 UTC |
| Eagle Creek (IN) at Eagle Creek Reservoir | 788.21 ft | – | no flooding | 2026-11-05 20:00:00 UTC |
| Northern Indiana Lakes at J.E. Roush Lake Dam Near Huntington (IN) | 745.87 ft | – | not defined | 2026-11-05 19:45:00 UTC |
| Deep River (IN) at Liverpool | 5.59 ft | – | no flooding | 2026-11-05 19:15:00 UTC |
| Salt Creek (IN) at Monroe Lake | 537.58 ft | – | no flooding | 2026-11-05 19:25:00 UTC |
| Northern Indiana Lakes at Mississinewa Lake | 730.76 ft | – | not defined | 2026-11-05 19:45:00 UTC |
| Cicero Creek at Morse Reservoir | 808.85 ft | – | not defined | 2026-11-05 19:45:00 UTC |
| Tippecanoe River below Oakdale Dam | 4.89 ft | 0.753 kcfs | no flooding | 2026-11-05 20:15:00 UTC |
| Tippecanoe River below Oakdale Dam | 4.89 ft | 0.753 kcfs | no flooding | 2026-11-05 20:15:00 UTC |
| Fall Creek (IN) at Geist Reservoir | 784.43 ft | – | not defined | 2026-11-05 19:45:00 UTC |
| Patoka River at Patoka Lake | 537.45 ft | – | no flooding | 2026-11-05 19:15:00 UTC |
| Northern Indiana Lakes at Salamonie Lake Dam | 748.19 ft | – | not defined | 2026-11-05 14:45:00 UTC |
NOAA National Water Prediction Service gauge readings (water.noaa.gov), read November 5, 2026; dated readings, not live (kcfs = thousand cubic feet per second).
Lake Michigan water level at Calumet Harbor
NOAA station 9087044 (Calumet Harbor, IL) read 578.701 ft above IGLD 1985 at 2026-11-05 14:30 local (LST/LDT).
NOAA CO-OPS station 9087044 (Calumet Harbor, Illinois side), read November 5, 2026.
Indiana rivers with the most NOAA gauges
NOAA National Water Prediction Service gauge readings (water.noaa.gov), read November 5, 2026; dated readings, not live (kcfs = thousand cubic feet per second).
Indiana Lake Levels and River Flows, with Indiana lakes in pictures

Photo: LouisvilleUSACE, CC BY 2.0
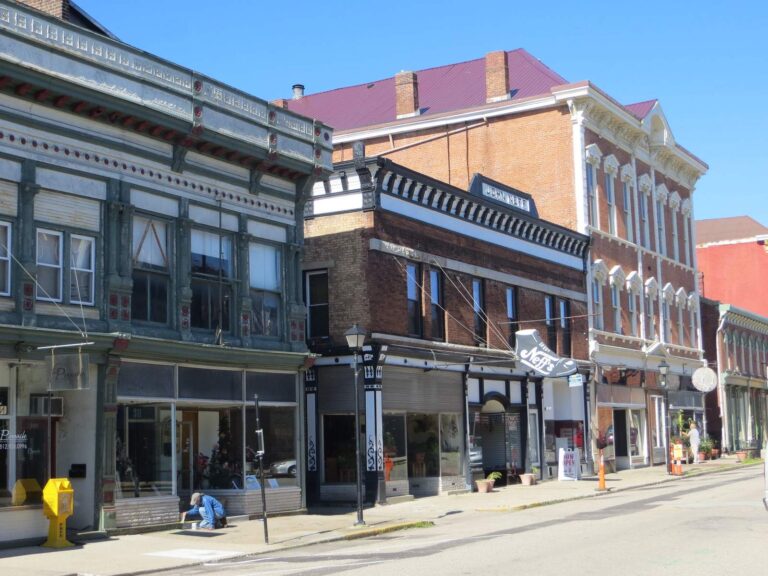
Photo: David Wilson, CC BY 2.0
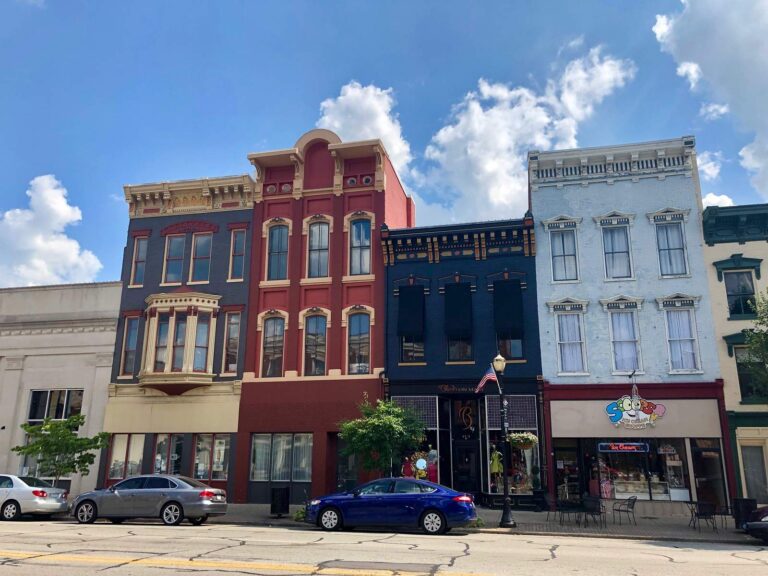
Photo: Warren LeMay, CC0 1.0
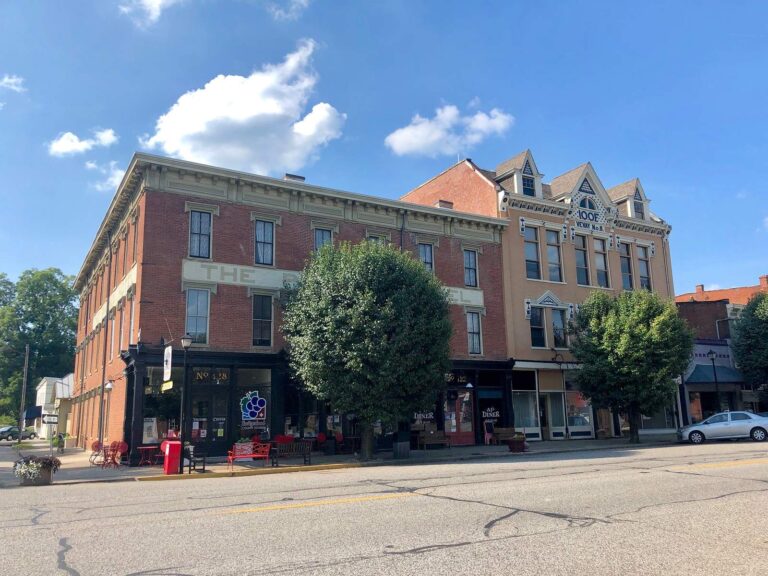
Photo: Warren LeMay, CC0 1.0
Indiana water level questions
Where can I check Indiana lake levels?
Here: the eight Corps reservoirs print their last pool reading, and USGS lake gauges print live on each lake page.
Which Indiana reservoirs does the Corps manage?
Cagles Mill Lake, Cecil M. Harden Lake, J. Edward Roush Lake, Monroe Lake, Mississinewa Lake, Patoka Lake, Salamonie Lake and Brookville Lake, all Louisville District.
Are the Corps pool figures live?
No. Each is one dated reading through NOAA, read November 5, 2026; times are UTC.
Which Corps pool sat highest on the last reading?
Salamonie Lake at 748.19 ft.
How many NOAA gauges cover Indiana?
258, 15 of them Ohio River pool or tailwater gauges.
Is there a Lake Michigan gauge on the Indiana shore?
NOAA lists no active Indiana station; Calumet Harbor on the Illinois side is the nearest.
What do pool and tailwater mean on the Ohio?
Pool is the water held above a dam; tailwater is the river just below it, where the 200-yard pole-and-line rule applies.
How often do these readings change?
USGS values update through the day; the dated Corps and NOAA figures here refresh when the page is rebuilt.